


CROWDS: HOW DOES MOTORSPORT STACK UP?
‘SUPERCARS is the third-most watched sport in Australia’.
It’s a big claim made more than once by the management of Australia’s premier category.
It just so happens to be something that can be backed up with numbers – meaning it’s more than just a dose of Public Relations spin designed to woo potential sponsors and keep existing backers content that people are watching.
The argument only gets better when you delve more broadly into the sport and take into account other elements of the sport that draw punters through the gate.
So the big question is: how does Motorsport compare to the AFL, NRL, A-League and other major Australian sports?
In this instance we’ll focus on physical attendance rather than TV numbers, but what unfolds below should give a broad overview of where Motorsport sits in the overall Australian sporting landscape.
MOTORSPORT CROWDS
ABOUT 1.6 million people will attend the 14 Championship events that make up the 2017 Virgin Australia Supercars Championship.
We’re using this as a base number in our calculations for overall attendance as the last time a full-season figure was released with any form of publicity was 2013, when 1,459,824 people attended events.
However rather than just focusing on the Supercars, we’ve eyeballed several other major ‘tier one’ events that should be included because there’s more than just Supercars in the major-event landscape here.
These include the Australian Grand Prix (approx. 280,000), Australian MotoGP (84,000 in 2015), World Superbikes at Phillip Island (61,067 in 2016), the Bathurst 12 Hour (40,364 this year) in 2017, Bathurst 6 Hour (17,847 in 2017) and the FIM Speedway Grand Prix at Etihad Stadium (17,000).
We’ve focused on the top-tier two and four-wheeled events here and have elected to avoid including events like Drag Racing, Speedway, either of the two domestic Superbike seires’, Shannons Nationals events or state-level competition – mainly because attendance figures for those disciplines are almost impossible to source with any reliability or accuracy.
There’s also an argument of comparing like-for-like that we’re taking into account: adding Shannons Nationals or Speedway attendance to the major events we’ve listed above would be like adding Victorian Football League or SA Football League crowds to the AFL totals outlined below.
For simplicity sake, we’re going to roll with what we have.
So, the number we’re working with here is a total attendance for top-flight Motorsport in Australia – rounded to the nearest 100,000 – of 2,100,000.
That’s based on 61 ‘event days’ that draw a crowd, between the 14 Supercars rounds at three or four days each and the various days of the other individual events we’ve listed.
This brings Motorsport’s average attendance, in the same way it is calculated and promoted for all other codes, to 34,426.
How does this compare to other sports? Turns out it’s pretty damn good. Here’s a rundown.
AFL
WHEN it comes to the major sporting codes in Australia and attendance, the AFL is the granddaddy of them all.
In 2016, 6.8 million people attended the 208 premiership matches and finals, for an average attendance of 33,188.
Remarkably, in 2016 that number placed the domestic code as the fourth-highest attended professional sporting league, in terms of average attendance, in the world – trailing only the NFL, Bundesliga (German Football) and the English Premier League.
In 2016 the AFL had a higher average attendance than Major League Baseball, the Indian Premier League Cricket and every other domestic association Football league in the world.
After 12 rounds of the 2017 season, average AFL Crowds are up approximately 3.4 per cent to just over 35,100 per game – bucking a broad trend of a general decline in sporting attendance.
NRL
IN 2016, just over 3.2 million people attended 201 National Rugby League games in Australia for an average of 16,063 people.
While the NRL competes head-to-head with the AFL in Australia for TV audiences (the State of Origin in particular now an enormous national drawcard irrespective of code loyalty), at-ground attendances remain a concern for the league.
In what will concern executives of the code, 2017 attendance has dropped a further 3 per cent after 14 rounds of the 2017 season, to a touch over 15,400 people per game.
There are similarities with Motorsport here because while the AFL has avoided the crowd decline that has come with the advent of every-game-live, high definition TV coverage, the general feeling is that League has been hit hard by the onset of the ability to watch everything from home.. rather than being stuck in Sydney traffic trying to get to the ground.
A LEAGUE
WHAT will worry NRL organisers even more is that soccer continues to grow in Australia, with the A-League attracting 1.7 million to their recently completed 2016-17 season, at an average of 12,700 people per game – less than half of one percent down on the previous season.
In terms of total attendance, the A-League is line-ball with Supercars in terms of overall attendance, though lags behind in TV ratings.
These numbers don’t include the stand-alone games played by visiting international clubs which generally draw impressive attendances, nor internationals played by the Socceroos on Australian soil.
CRICKET
CRICKET has drawn an enormous legion of new fans in the last five years thanks to the success of the Big Bash League.
Taken in isolation, the BBL’s rise has been remarkable to the point where last summer the league drew 1.05 million people at an average of 30,114 per game.
Against 2016 global attendances around the world, that number ranks the BBL sixth which is frankly astonishing for what is domestic cricket.
Cricket Australia released a total attendance of 1.86 million for their total 2016-17 international summer, that includes the BBL, Womens BBL and all Australian internationals played on home turf, though that number fluctuates dramatically given the drawing power of the international visitors.
For example, expect that number to swell dramatically when the English visit this Summer for the Ashes for what is expected to be a series of sold-out test and one-dayers.
OTHER SPORTS
Outside of the ‘big four’, there’s little else to compare.
The National Basketball League has done a good job of rebuilding itself in recent years and attendance has increased, though finding a total number remains impossible. Our research suggests an average attendance of over 6,000 per game.
The same can be said for Netball, with the last figures we could find pointing to about 4,000 people per game attending the 2012 ANZ Championship season.
SO WHAT HAVE WE LEARNED?
IN this relatively simple study we can learn that our sport really does stack up alongside the major codes in Australia.
Where the AFL and the NRL attract more people overall, they also do it by having between seven and nine games each weekend for 22-26 weekends of the year, plus finals to do so.
Still with only 61 days in which to draw, Motorsport’s 2.1 million people comfortably ranks it third in all sports, ahead of Cricket and Soccer domestically.
Even taken in isolation, Supercars 1.4-1.6 million attendance places them comfortably at a level similar to both of those sports.
On an average attendance basis, the large overall number in a relatively small number of days means that the average of more than 34,000 means that the sport is line ball with AFL and miles in front of the other codes – though our small sample size ensures it’s a pretty sexy number that drops considerably when events like Speedway, Drag Racing, Shannons Nationals and state level events are taken into account.
For instance, if we conservatively add another 60 days of competition between those various series, at a guesstimated average of 2,500 per day, the overall average number drops to a still-reasonable 18,500 – still above everything sans AFL and the Big Bash.
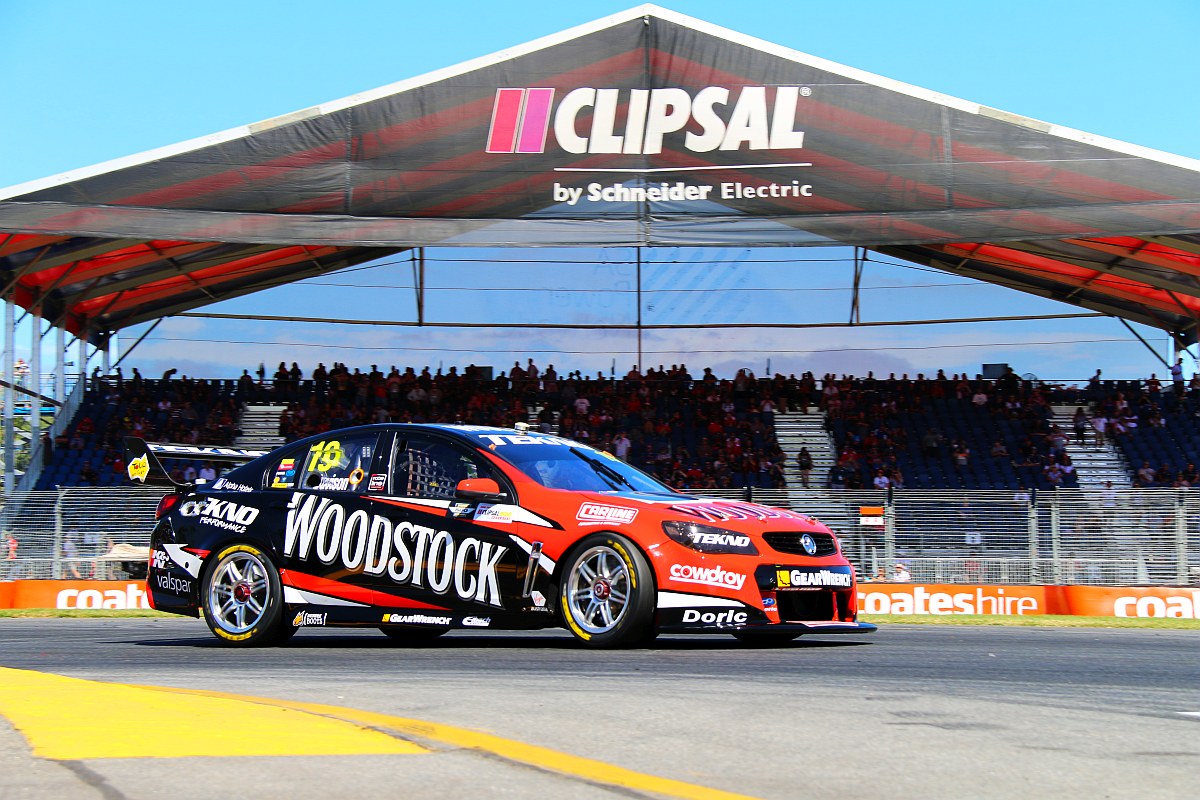
Like the other codes, the average attendance number is driven up by the big events (100,000 on the Sunday of the Grand Prix, 75,000 on the Saturday of the Clipsal 500) and balanced out by smaller attendances (we’d guess 2,000 on the Friday of a Winton or Phillip Island Supercars round).
The biggest issue remains driving up the smaller events, like Phillip Island and Sydney Motorsport Park’s Supercars rounds, and capitalise on the growth of those quickly growing like Bathurst’s 12 and 6 hour enduros.
We think these numbers prove that while yes, some events draw small crowds, the overall numbers paint our sport in reasonably good health and competitive with the other ‘majors’ in the local sporting landscape.
The trick, of course, is to continue to grow it and how to do that is the current million dollar question driving sports promoters everywhere.
| Code / Season | Total Attendance | Games / Days | Average attendance |
| 2016 AFL | 6,869,999 | 206 | 33,188 |
| 2016 NRL | 3,228,623 | 201 | 16,063 |
| 2016 Motorsport Season | 2,100,000* | 61 | 34,426 |
| International Cricket Summer16-17 | 1,863,846 | 127 | 14,675 |
| (2016-17 BBL 06 | 1,053,997 | 35 | 30114) |
| 2016-17 A League | 1,770,616 | 140 | 12,647 |
*Estimated / Rounded number
Sources:
www.twitter.com/footyindustryAU
www.austadiums.com
Sports Attendances
WORDS: Richard Craill
Richard Craill (administrator)
Working full time in the motorsport industry since 2004, Richard has established himself within the group of Australia’s core motorsport broadcasters, covering the support card at the Formula 1 Australian Grand Prix for Channel 10, the Bathurst 12 Hour for Channel 7 and Porsche Carrera Cup & Touring Car Masters for FOX Sports’ Supercars coverage. Pretends to be a PR guy / Journalist and sometimes photographer to make ends meet when not yelling at a television in a padded room.


